WC26 Sustainability: The Carbon Math of a 48-Team Mega-Tournament
Three host countries, 16 venues, 104 matches and an estimated nine million fan-miles per matchday. The carbon arithmetic of the biggest World Cup ever — and what FIFA's sustainability strategy actually commits to.
Every World Cup since 2006 has come with a sustainability brochure attached, each one slightly louder than the last. The 2022 tournament in Qatar tested how far the brochure language could be pushed when reality was working against it; FIFA's carbon-neutral claim was challenged at every step, with Switzerland's fair-trading commission ultimately ruling against the federation in 2023 for unsubstantiated environmental claims (per Reuters coverage). For 2026, the federation has dropped the neutrality language entirely. The published targets are smaller, the audit promises more concrete, and the structural problem — 104 matches across 6,000 kilometres of geography — is the largest in tournament history.
This is the working state of the WC26 sustainability story as of 2026-05-20, three weeks from kickoff. We have leaned on FIFA's Sustainability Strategy documents, Carbon Market Watch's pre-tournament analyses, BBC reporting through 2025-Q4 and early 2026, and the operational sustainability disclosures published by individual host stadiums.
The headline numbers (with hedges)
A note on numbers: FIFA has not published a pre-tournament emissions forecast for 2026 of the type it released for Qatar 2022. The federation's Sustainability Strategy 2026 commits to a post-tournament audit and a 50% reduction target relative to "the projected 2026 baseline" — itself a deferred-disclosure exercise. Per Carbon Market Watch's January 2026 working note, the public absence of a pre-tournament forecast is one of the most flagged transparency gaps of this cycle.
The estimates carried by BBC, Reuters and academic analyses (Lancaster University's sport-emissions research group, among others) put the tournament total in the 6 to 12 megatonne CO₂e range — roughly two to three times the 2022 Qatar figure. The structural reason is straightforward: a three-host, 48-team, 104-match tournament has more flights in it than any prior World Cup, and travel dominates the emissions profile.
Why travel is ~80% of the footprint
Across recent World Cups, the published audits have consistently put travel at 70-80% of tournament emissions. The 2026 expansion amplifies that share:
- 48 teams instead of 32 — adds team and entourage flight volume.
- 16 venues across 3 countries — adds intra-tournament travel for teams, broadcasters, officials and fans.
- A 32-day window with 104 matches — the densest schedule in WC history, but also more matchdays to draw international fans across.
- Up to 5.5 million spectator attendances (estimate per FIFA's stadium-capacity arithmetic) — more total seats than any previous edition.
The single biggest emissions multiplier is spectator long-haul flights. A round-trip economy flight from Europe to North America is in the 1.5-2.5 tonne CO₂e range per traveller; multiply by a few hundred thousand European travelling fans and the number dominates everything else combined.
The 16-venue tradeoff: a comparison with USA 1994
The cleanest direct comparison for WC26 is USA 1994 — the last single-host North American World Cup. 1994 had 52 matches in 9 venues across 9 cities, all within a single country. WC26 has 104 matches in 16 venues across 3 countries.
The tradeoff is real:
- Match doubling doubles spectator-trip volume.
- Venue expansion adds intra-tournament team travel — every team plays in 3-4 different cities through the group and round of 32, and the bracket from the round of 16 onwards funnels through US venues with significant geographic spread.
- Three-country hosting adds cross-border travel for fans following a single group with cross-border fixtures (see our breakdown of the cross-border fan-travel reality).
The countervailing factor — and FIFA emphasises this repeatedly in the Sustainability Strategy — is that the tournament uses existing infrastructure. None of the 16 host stadiums was purpose-built for WC26. This avoids the construction-phase emissions that dominated Qatar 2022's pre-tournament footprint. It does not change the operational-phase math.
Stadium energy: which venues are doing what
The 16 host stadiums sit on a wide spectrum of energy footprint. The disclosures are not standardised, but a few have published meaningful certifications:
- Mercedes-Benz Stadium (Atlanta) is the only LEED Platinum stadium in the host roster, certified in 2017. Its sustainability page details rainwater capture, on-site solar, and a 47% reduction in energy use versus a baseline NFL stadium per its 2024 disclosure.
- Levi's Stadium (Santa Clara) is LEED Gold certified.
- SoFi Stadium (Inglewood) is LEED Gold and uses a high-efficiency cooling design suited to closed-roof matches in mild LA weather.
- MetLife Stadium is LEED Silver certified; FIFA's final venue.
- BC Place (Vancouver) runs on BC Hydro's predominantly-hydroelectric grid — the cleanest electricity grid of any host venue in the tournament. Per BC Hydro's 2024 figures, the grid is ~98% renewable.
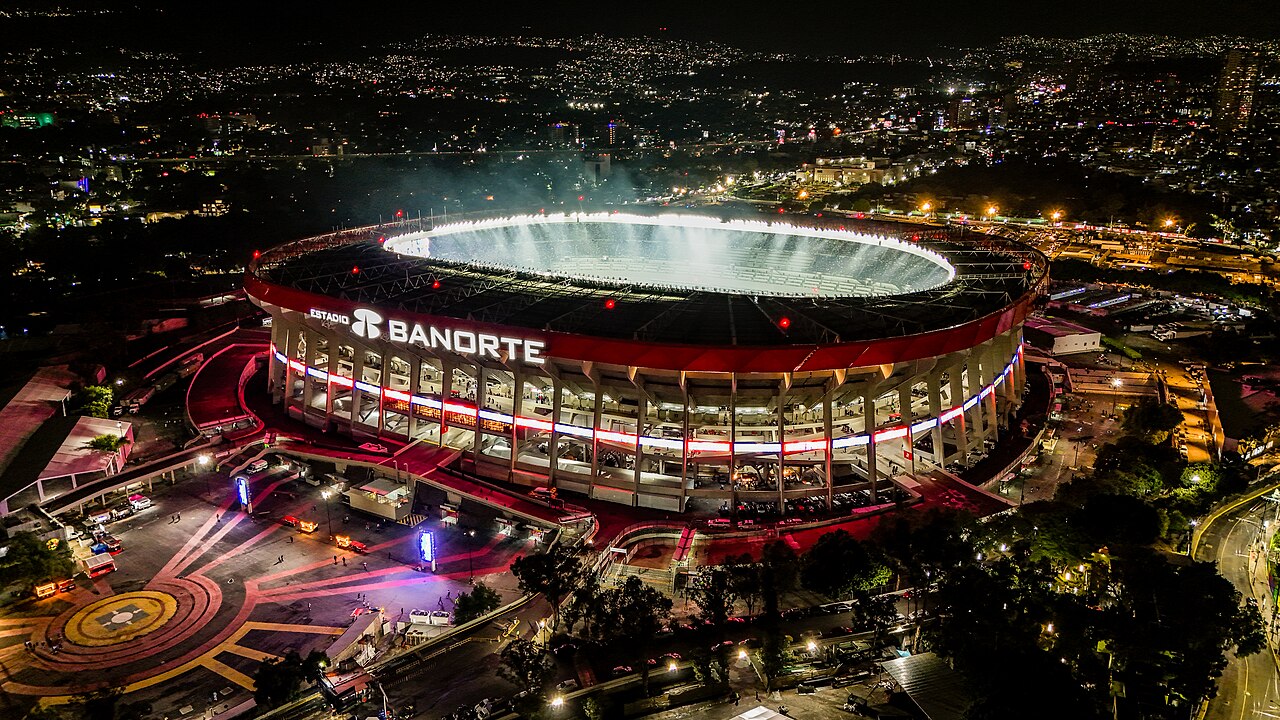
- Estadio Azteca does not have a comparable Western-system certification; its post-renovation operational disclosures (per TelevisaUnivision's pre-tournament reporting) emphasise water-recycling upgrades but stop short of LEED-style energy certification.
The pattern: the Pacific Northwest and California venues have the cleanest grid context; the Texas venues (AT&T, NRG) are tied to ERCOT's still largely natural-gas-dominant grid; Mexico City's CFE grid sits somewhere in between. Per Carbon Market Watch's January 2026 brief, venue-energy emissions are a small share of the total (~5-10%) and unlikely to move the headline number meaningfully whichever way the venues lean.
Player travel: 7 matches, charter dominant
A team that reaches the final plays 7 matches over 32 days. For 2026, the bracket structure means a finalist could feasibly travel through:
- Mexico City (group)
- Guadalajara or Monterrey (group)
- Dallas / Atlanta / Kansas City (group, possibly cross-border)
- An R32 venue (could be any of 16)
- An R16 venue (US)
- A QF venue (US)
- A SF venue (US)
- The final at MetLife
That's potentially 8 flights, mostly intra-tournament charter. Charter flights are emissions-intensive per-passenger because the load factors are far lower than commercial aviation. The Athletic's pre-tournament analysis from 2025 estimated per-team travel emissions in the 200-500 tonne CO₂e range for a deep-running team — a non-trivial number when multiplied by 48 teams.
FIFA's stated mitigation per the Sustainability Strategy is regional grouping — placing teams within geographically clustered group venues. The 2025 group draw (per FIFA's draw mechanic) did honour that for some groups; not all. The cross-border groups in particular (notably Group D's BMO Field / Gillette pairing) push intra-tournament travel up.
Broadcaster fly-in tonnage
The broadcast and media corps for a World Cup typically numbers 10,000-15,000 accredited journalists and crew. For 2026, FIFA's accreditation projections (per Sports Business Journal coverage) land at the top of that range — likely the largest media corps in tournament history. The fly-in tonnage from those credentialed alone is in the low-to-mid five-figure tonne range for the round-trip emissions.
The structural fact: every host city hosts roughly 2,500-3,500 accredited media at the venue during matches. That's a small city's worth of medium- and long-haul travellers in transit for every matchday.
Fan miles
The 5.5 million estimated spectator attendances translate to several hundred million fan miles across the tournament. The geographic breakdown matters:
- Local / regional fans (within 200 miles of a venue): low per-trip emissions, often ground transit.
- Domestic flyers (within-country, e.g. New York to LA): meaningful but moderate per-trip emissions.
- International travelling fans: the dominant per-trip footprint. A European fan with a round-trip pair of long-haul flights and intra-tournament hops is the highest-emissions fan archetype.
Per FIFA's projections (per April 2026 Reuters reporting), an estimated 1.5-2 million international tickets will be held by long-haul travellers. That cohort alone, on rough per-traveller multiplication, dominates the entire tournament emissions ledger.
The country breakdown above is directional — the US share is dominated by intra-tournament flights and the spectator share for the 80 US-hosted matches. Mexico's share is weighted by the international travelling-fan emissions, not by domestic Mexican spectators. Canada's share is the smallest by both match count and travelling-fan volume.
Comparison to Qatar 2022's controversial claim
Qatar 2022 was claimed by FIFA at the time as the first carbon-neutral World Cup, a claim FIFA later acknowledged was overstated. Per Reuters' reporting on the Swiss Fairness Commission's June 2023 ruling, FIFA was found to have made unsubstantiated environmental claims. The claim was withdrawn in subsequent communications.
The Qatar figures, per FIFA's own post-tournament audit:
- 3.6 megatonnes CO₂e total emissions estimate (pre-tournament; post-tournament audit raised this to ~5 Mt per Carbon Market Watch reanalysis).
- Offset purchases — primarily through the Global Carbon Council — challenged by NGOs as low-quality or unverifiable.
- Construction emissions were the biggest single driver: seven new stadiums, all built for the tournament.
WC26 does not carry the construction-phase footprint. It almost certainly carries a larger operational-phase footprint than 2022. The published target — a 50% reduction relative to a baseline — is more modest than "carbon neutral", more honest, and more difficult to grade because the baseline itself remains opaque.
The key word in the bulletin's language is "residual" — the offset commitment applies only to what cannot be reduced. That is a meaningful change from the 2022 framing.
What fans can actually do
The honest answer is that per-fan emissions reductions at a tournament of this scale are dominated by the choice of how to travel:
- Choose direct flights over connecting — the takeoff-and-landing fuel burn is the high-intensity phase.
- Combine matches into fewer trips — a single 10-day visit with multiple matches is dramatically better than three separate weekend trips.
- Ground transit where possible — the I-5 Cascadia corridor (Seattle-Vancouver), the I-35 corridor (Dallas-Monterrey) and intra-Northeast Acela/NJ Transit options materially beat regional flights for emissions per traveller.
- Hotel choices matter, marginally — LEED- or BREEAM-certified hotels in the host cities will have ~20% lower energy footprint per night than the regional average. Significant only at scale.
For the fans who can't or won't travel internationally, the lowest-footprint option remains watching from home; per BBC's sports-climate desk reporting, a single transatlantic round-trip flight emits more per traveller than an entire household's tournament-month TV viewing.
Where the numbers will land
Three weeks out, with no published pre-tournament forecast from FIFA, the working estimates from independent analysts converge on 8-10 megatonnes CO₂e as the most-likely tournament total. That's roughly double the Qatar 2022 audited figure and roughly four times the 2018 Russia figure.
The post-tournament audit, due per FIFA's stated timeline in mid-to-late 2027, will settle the question. Expect the same NGO scrutiny that followed 2022 — Carbon Market Watch and the climate-and-sport academic community have already flagged the methodology assumptions to watch.
FAQ
Frequently asked
Is the 2026 World Cup carbon-neutral?
How big is the WC26 carbon footprint likely to be?
Which host stadium is greenest?
How does WC26 compare to USA 1994 for emissions?
Is FIFA buying offsets to balance emissions?
What can fans do to reduce their footprint?
Where can I read FIFA's official sustainability documents?
For the bigger picture on what the 48-team format and the 16-venue layout mean for the tournament as a whole, those guides put the sustainability story in operational context.
Sources (8)
- FIFA — Sustainability Strategy 2026accessed 2026-05-20
- Carbon Market Watchaccessed 2026-05-20
- BBC — World Cup coverageaccessed 2026-05-20
- Reuters — sustainabilityaccessed 2026-05-20
- Associated Press — climate hubaccessed 2026-05-20
- The Athletic — WC26accessed 2026-05-20
- Mercedes-Benz Stadium — sustainabilityaccessed 2026-05-20
- BC Placeaccessed 2026-05-20
Sources (8)
- FIFA — Sustainability Strategy 2026accessed 2026-05-20
- Carbon Market Watch — FIFA sustainability analysesaccessed 2026-05-20
- BBC — World Cup environmental coverageaccessed 2026-05-20
- Reuters — sports and climateaccessed 2026-05-20
- Associated Press — climate and sportaccessed 2026-05-20
- The Athletic — World Cup 2026 coverageaccessed 2026-05-20
- Mercedes-Benz Stadium — sustainability certificationsaccessed 2026-05-20
- BC Place — sustainability pageaccessed 2026-05-20
You might also like